CRM and case-management systems
Record status and activity, but do not ensure that critical Handoffs complete on time.
Intake yield management for PI firms.
LexSteer helps PI firms understand where intake performance is being lost, ranks the findings, verifies the improvements management chooses, and governs the conditions management wants to sustain.
It is designed first for the COO, intake director, and operations leader who need a factual picture of how intake is behaving day to day, and then for firm leadership that needs confidence the findings are real, the rollout is controlled, and the gains will hold over time.
The sequence is controlled: Visibility analyzes the firm's historical data and surfaces ranked findings; management investigates the underlying issue, decides what to change, and implements it; Visibility verifies the result against its baseline. For conditions management decides are worth sustaining, LexSteer runs Shadow Mode once so the firm can see how Governance would behave before granting it authority to act. Governance can then supervise those conditions during execution.
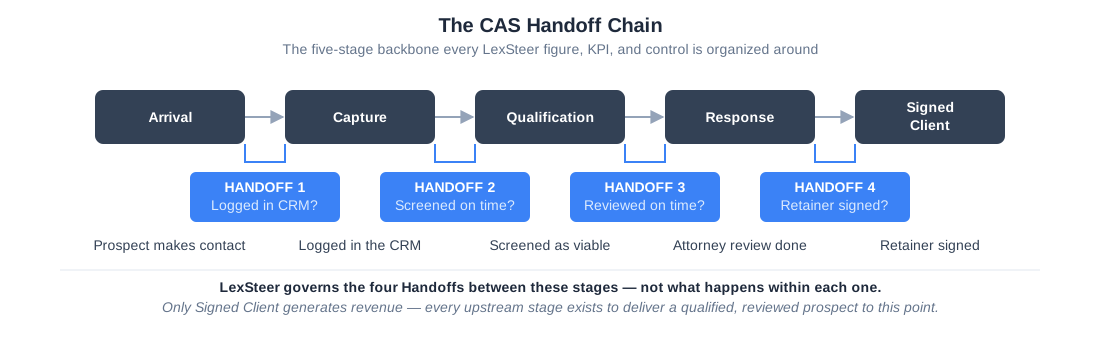
LexSteer works alongside the systems that run the practice. The CRM, the phone system, the case-management platform, workflow automation, and analytics — everything a firm already relies on day to day — do real jobs well: they record what happened, route what's next, and execute the work in front of them.
None of them is built to help management determine systematically whether the intake operation is getting better, verify whether improvements worked, and supervise the critical Handoffs — the transitions where intake work moves from one person, system, or stage to another — and other operating conditions management decides to govern. That's a different job, not a better version of the same job:
Record status and activity, but do not ensure that critical Handoffs complete on time.
Communicates — connects the call, routes it, logs that it happened.
Can trigger actions, but often assumes the action was completed unless a separate verification step confirms it.
Explain the past, but usually do not intervene in live stalled work.
Accelerates bounded tasks inside whatever system it's layered on, without owning the question of whether the chain it sits inside is actually holding together.
Can improve operating design, but they do not usually remain inside the live system governing whether the gains hold.
Often approximate this job through effort and oversight, but that layer of attention is usually fragmented, inconsistent, and not timely enough for perishable demand.
LexSteer continuously observes intake performance and supports the improvement discipline those systems were never built to run: run vs. improve, not a bigger stack vs. a smaller one.
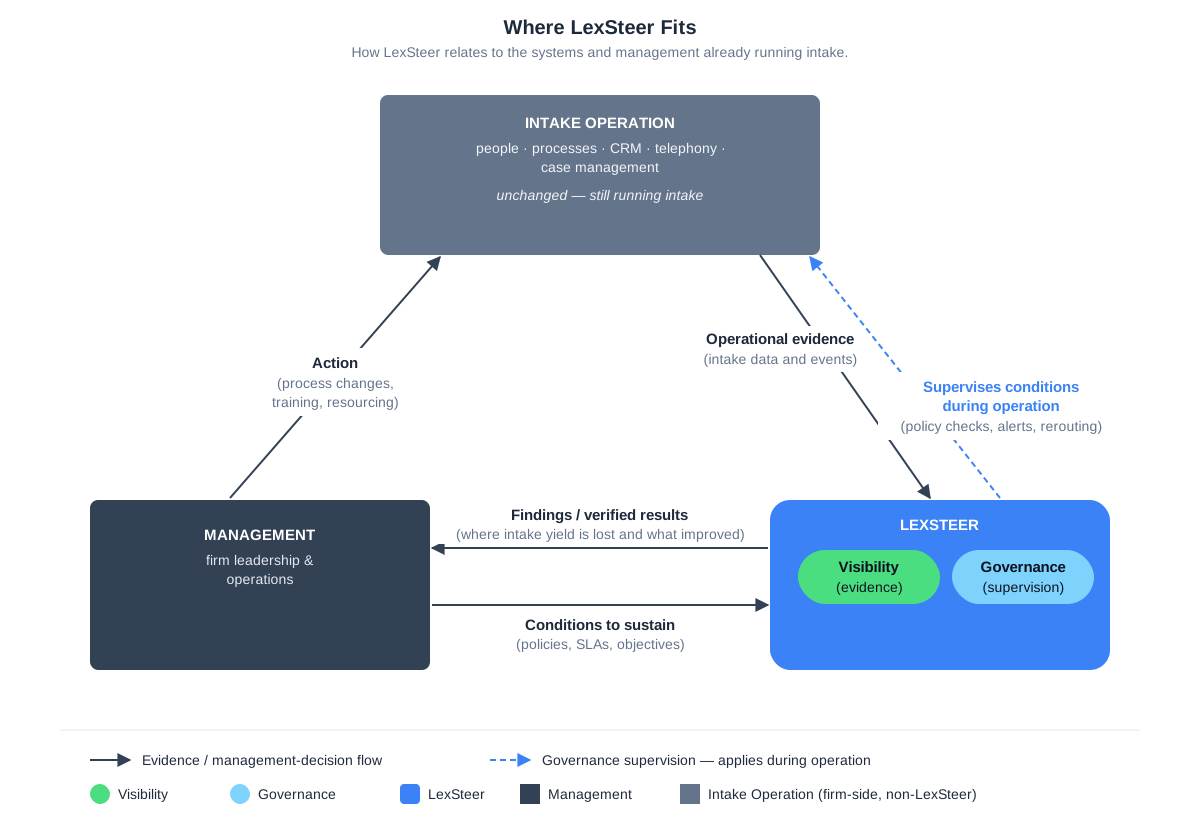
The systems that run intake remain in place. LexSteer works from the evidence they produce, adding the visibility, verification, and governance management needs to continuously improve performance. LexSteer reads from the firm's telephony and CRM systems continuously; under the Governance Pack, it writes back selectively — escalations and reassignments — only when a Handoff has stalled past its configured response window.
The Visibility Pack begins with a structured analysis of the firm's historical intake data, typically across roughly 180 days of inbound arrival records, CRM activity, and intake-stage movement.
The purpose is not to generate another dashboard. It is to identify where cases disappeared, attribute that loss to the right source, and give operations and leadership a shared factual starting point for action.
LexSteer evaluates intake against the core loss framework used across the site:
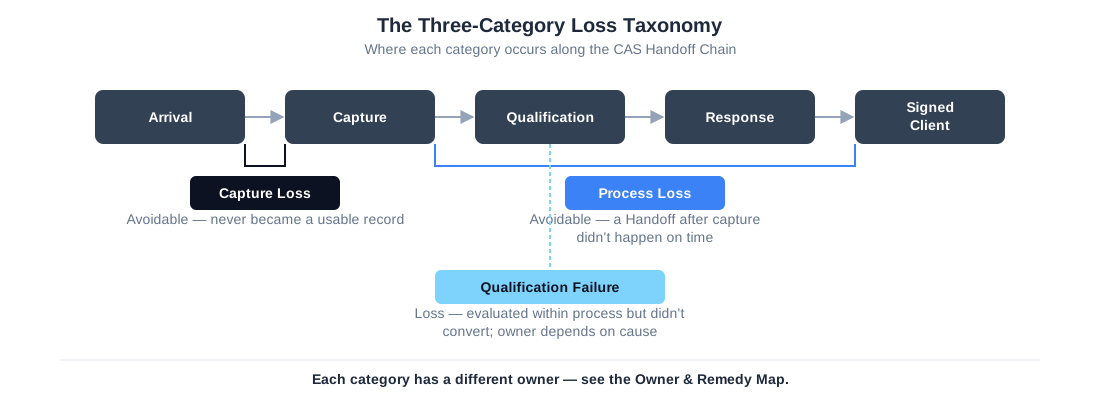
That's the taxonomy the rest of the Visibility Pack works from — three distinct classes of loss, with different causes and different owners, not one blended “conversion rate.”
Seeing loss this way — broken out by stage rather than blended into one aggregate conversion number — already starts to answer a harder question: whether a problem is showing up now, while it is still visible at the stage where it originates, rather than waiting for it to eventually drag down the signed-case total everyone is already watching. Sustain the Improvement, below, extends the same idea into live, continuous monitoring; this is where it starts, on historical data, before Governance is ever activated.
Telling the three apart isn't always instant. Prospects handled within the firm's configured Attribution Confidence Window set the floor: whatever still doesn't qualify at that speed is a Resolved, high-confidence Qualification Failure attribution — a clean lower-bound estimate, since response speed is no longer a credible explanation.
Past that window, the rejection rate climbs — but that rise mixes Qualification Failure with Process Loss in a way timing data alone can't separate. The Visibility Pack calls this population Non-Distinguishable, and reports it as such rather than guessing. As response times improve, the Non-Distinguishable population shrinks and the Qualification Failure estimate sharpens — a progressive narrowing that begins to resolve the three-way argument with evidence, not a single clean finding on day one. Ruling out timing this way also doesn't, by itself, say who owns the fix: a Resolved Qualification Failure still splits into Qualification Failure — Lead Quality or Qualification Failure — Judgment, separated by the Qualification Failure Dispersion Check, not assumed by default.
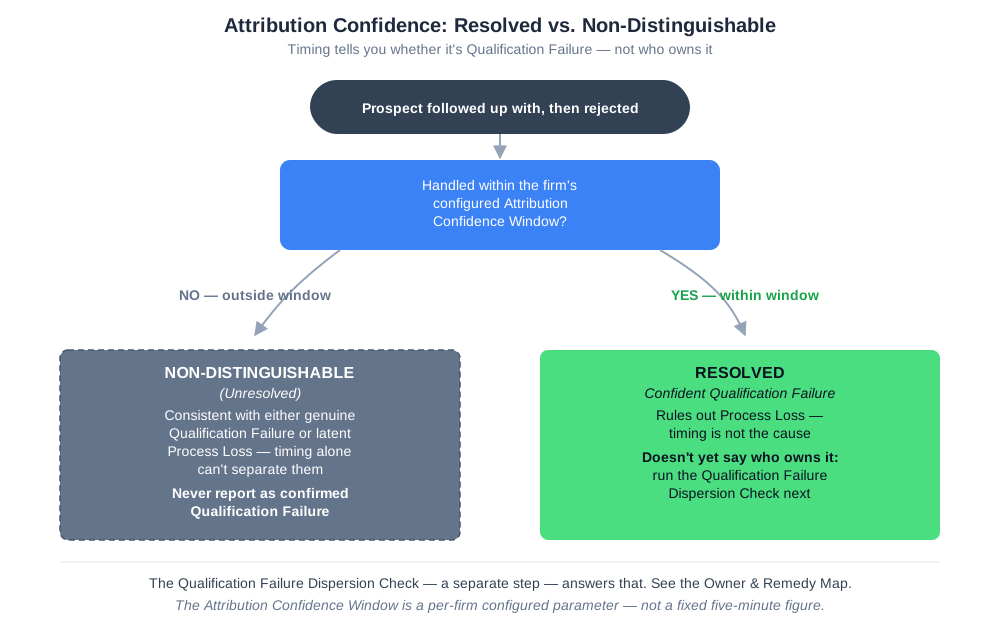
Resolved and Non-Distinguishable are exactly what the map above shows — a floor you can trust immediately, and a population that narrows as response speed improves.
Illustrative Visibility Pack sample, drawn from one internally consistent synthetic dataset — every percentage below reconciles to an underlying integer count and to the stage before it. The figures are not any real firm's data.
What the Visibility Pack found:
The detail behind each of those four lines follows below.
7-Attorney PI Firm, Midwest. 180-day analysis, report generated March 2026.
| Stage | Count | % of arrivals | Stage conversion |
|---|---|---|---|
| True arrivals | 1,800 | 100.0% | — |
| CRM captured | 1,404 | 78.0% | 78.0% (Capture) |
| Contacted within required window | 1,264 | 70.2% | 90.0% (CFR) |
| Qualified | 1,095 | 60.8% | 86.6% (FQR) |
| Attorney consultation | 684 | 38.0% | 62.5% |
| Retainer offered | 540 | 30.0% | 78.9% |
| Signed | 432 | 24.0% | 80.0% |
CFR — Contact Follow-up Rate: of prospects captured, the fraction contacted inside the firm's own configured response window. FQR — Follow-Up-to-Qualified Rate: of those contacted, the fraction that passed intake qualification.
Your CRM only shows what got captured. The Visibility Pack reconstructs the arrivals you never logged — prospects you paid for that appeared as nothing.
396 prospects reached you and were never logged — every one paid for.
True arrivals span every inbound channel — telephony, web form, SMS, WhatsApp, and chat. Telephony calls that disconnect within 15 seconds are excluded as likely misdials (the threshold is configurable); web, SMS, and chat submissions are counted regardless of duration, since any deliberate submission signals a prospect.
Relative concentration of the 396 missed arrivals — darker cells are heavier loss. After-hours cells are structural. Business-hours cells are recoverable through governance.
Missed arrivals heatmap
| 12a | 3a | 6a | 9a | 12p | 3p | 6p | 9p | |||||||||||||||||
|---|---|---|---|---|---|---|---|---|---|---|---|---|---|---|---|---|---|---|---|---|---|---|---|---|
| Mon | ||||||||||||||||||||||||
| Tue | ||||||||||||||||||||||||
| Wed | ||||||||||||||||||||||||
| Thu | ||||||||||||||||||||||||
| Fri | ||||||||||||||||||||||||
| Sat | ||||||||||||||||||||||||
| Sun |
Illustrative example. Your Visibility Pack is built from your firm’s own data.
under 5 min
18%
5–15 min
12%
15–60 min
20%
1–4h
28%
4–24h
17%
over 24h
5%
Prospects in the slower buckets are at elevated risk of competitive loss before contact is made.
Week-by-week, the firm's Process Failure Rate is tracked as a statistical pattern and classified using the same four-state health model — Stable, Improving, Deteriorating, Unstable — described under Sustain the Improvement below, so a genuine trend is never confused with ordinary week-to-week noise.
Illustrative example. Your Visibility Pack is built from your firm’s own data, including SPC analysis across all tracked stages.
Contact Follow-up Rate (CFR)
90.0%
StablePROCESS (OPERATIONS)
Benchmark: ≥ 85% — higher is better. Measured against this firm's own configured response window, not a fixed industry threshold.
Qualification Failure Rate
13.4%
StableDIAGNOSED BELOW — OPERATIONS OR MARKETING
Lower is better.
The Qualification-vs-Process split is only clean for prospects handled within the firm's configured Attribution Confidence Window. For those, delay is not a credible explanation for non-conversion, so a rejection at qualification confidently rules out a timing problem. For prospects handled more slowly, the cause is ambiguous — the data alone cannot separate a genuine decline (or an agent's misjudgment) from Process Loss.
Qualification Failure
Resolved103of 169 failures — 61%
Handled within the configured Attribution Confidence Window. Timing is confidently ruled out — see the Dispersion Check below for whether the remaining cause is lead quality or agent judgment.
Non-Distinguishable
Unresolved66of 169 failures — 39%
Response was delayed; cause is ambiguous. Consistent with either a genuine decline or Process Loss. As response speed improves, this population thins and the estimate sharpens.
Qualification Failure — Resolved is confidently attributed within the configured Attribution Confidence Window. The remainder is Non-Distinguishable — Qualification Failure and Process Loss that timing data alone cannot separate. Counts and percentages reconcile to the sample dataset above.
Ruling out timing isn't the same as knowing who owns the fix. A confirmed Qualification Failure could mean the leads themselves aren't converting — Qualification Failure — Lead Quality — or it could mean an intake agent is misjudging cases that should have qualified — Qualification Failure — Judgment. Both produce the identical outcome and timing signature.
The bigger loss sits at a different Handoff.
Qualification Failure — even fully diagnosed — accounts for 169 of the 1,800 arrivals. A larger, separately-owned loss shows up one stage later: of the 1,095 prospects who qualified, only 684 reached an attorney consultation. That's 411 qualified prospects — 37.5% of the qualified population — stalled at the qualified-prospect-to-consultation Handoff. This is not a lead-quality question, and it is not the same finding as Qualification Failure — Judgment below: it is Process Loss at a specific, later Handoff, and on this sample firm's numbers it is the larger of the two losses.
Qualification Failure Dispersion Check — who owns the 103
The Resolved share splits further into one of three outcomes: Qualification Failure — Lead Quality (the cause tracks the leads, not the people), Qualification Failure — Judgment (declines concentrate with specific intake agents — a coaching and training question, not a marketing one), or Qualification Failure — Undetermined (Shared Cause) (the data doesn't yet support a confident split either way, and the honest answer is to say so rather than guess). LexSteer's Dispersion Check looks at how declines are distributed — across agents, and across lead channels — to determine which of the three applies, rather than defaulting to an assumption in either direction.
Blind Spot
Pending data fieldLead source field population in your CRM is required to produce channel-level attribution. This finding is available once source tracking is configured.
What recovering the bigger loss is worth.
Not all 411 stalled prospects would have signed — only the firm's own observed downstream conversion should be applied. At this sample firm's observed consultation-to-signed rate (432 signed ÷ 684 consultations = 63.2%):
| Recovery of missed Handoffs | Additional signed cases / yr |
|---|---|
| 10% | ~52 |
| 20% | ~104 |
| 30% | ~156 |
| 50% | ~260 |
180-day figures annualized. Recovery = missed Handoffs × recovery rate × the firm's own 63.2% consultation-to-signed rate, doubled to a 12-month basis.
The 50% row matches the leakage calculator's own default recovery target further down this page, which states its own 30–50% conservative-starting-point guidance. Same math, different assumed recovery rate — not two methods. Typed into that calculator, this firm's numbers sit at or better than benchmark on process and qualification, and worse on capture (22.0% loss against an 18% benchmark) — and at 49.3% against an 80% benchmark on qualification-to-retainer. That qualification-to-retainer gap is the finding.
Converting a given row into a dollar figure requires the firm's own average contribution margin per signed case — the Visibility Pack does that conversion using the firm's own numbers, never an industry-average one, and only once the firm has supplied them.
Illustrative example. Your Visibility Pack is built from your firm’s own data.
 Visibility Pack — Intake Diagnostic
 Sample Report — 7-Attorney PI Firm, Midwest
Stage-by-Stage Fallout
37.5% of qualified prospects — 411 of 1,095 — stalled before reaching attorney consultation, the firm's largest single operational loss.
Verdict: Primary finding — the qualified-prospect-to-consultation Handoff. Secondary finding — Qualification Failure — Judgment, concentrated among two intake agents.
Recovering 10% of the missed Handoffs implies roughly 52 additional signed cases per year, at this firm's own observed consultation-to-signed rate (180-day figures annualized). Revenue and recovery target are yours to set — at your average case economics, that is the recoverable value.
Report generated: March 2026 | Data period: 180 days
Your data stays within the scope of intake, CRM, and telephony records — the Visibility Pack works from operational metadata about your intake process, not clinical or treatment records.
To run the Visibility Pack, LexSteer works from the firm's historical data under standard confidentiality safeguards. The process begins with a mutual NDA and relies on a guided export session so the firm can provide the necessary historical records without LexSteer taking control of live operations. The data in scope is intake, CRM, and telephony metadata — call and message records, timestamps, and stage movements — not clinical or treatment records. Live-channel integrations — telephony, web, SMS, chat — are built during this same onboarding process, matched to each firm's actual systems.
At this stage, the goal is to establish the evidence, not intervene in live operations. The Visibility Pack is a bounded historical analysis designed to show what happened, where it happened, and what it may be costing.
A firm-specific view of where loss is concentrated across the intake journey, including where opportunities disappeared by stage and source.
LexSteer calculates the case-count opportunity directly from its own observations — for example, recovering 10% of a specific missed Handoff implies a specific number of additional signed cases per year. Converting that into a dollar figure depends on the firm's own case economics: where the firm supplies its average contribution margin per signed case, the Assessment translates the same recovery into an estimated financial opportunity, never a generic industry figure.
A ranked view of findings based on the available evidence and operational significance. Management uses that ranking together with economics, strategic importance, implementation effort, capacity, risk, and other business considerations to decide what to prioritize. Ranking isn't by raw metric size alone — each finding is surfaced because it violates a threshold the firm itself configured, because it diverges materially from the firm's own peer pattern (which agent, which channel), or because it shows a genuine statistical shift rather than ordinary week-to-week noise. That three-part basis (Significance Type: Policy, Comparative, Statistical) is what keeps the ranking grounded in evidence rather than a generic checklist.
Visibility's initial analysis produces ranked, evidence-based findings — not a prescription. Management uses that evidence to investigate the underlying issue, prioritize what deserves attention, and choose what to change. That boundary matters because it's what keeps LexSteer's Visibility output trustworthy as evidence rather than as a sales pitch for a particular fix.
Once management decides, it implements the change — a staffing adjustment, a revised process, a new escalation rule, a different tool. That's where most improvement efforts already stop, and it's also where they tend to quietly unwind: staff turn over, priorities shift, and a change nobody is watching stops happening the way it was designed to. Making a change and sustaining it are two different problems — and before either one, there's a prior question: did the change actually work? Visibility answers that first; see Verify the Improvement, below. Only for the conditions worth protecting long-term does the firm move to Shadow Mode — a one-time, read-only check of how Governance's rules would behave — before activating Governance, which is what keeps the change holding and is what the rest of this page covers.
Making a change is not the same as knowing it worked.
Visibility establishes the baseline for the targeted condition — a stage's conversion rate, a Handoff's timing, a failure rate — before the change. Once management implements the improvement, Visibility continues measuring that same condition against the baseline. The question isn't only whether a downstream metric moved. It's whether the targeted condition improved, by how much, and whether that matches what management expected when it made the change.
LexSteer tracks this the same way it tracks every stage on this page: each condition is classified Stable, Improving, Deteriorating, or Unstable. A change first shows as Improving; it counts as verified once the targeted condition settles into Stable at the new, better level — not the moment an early gain appears, and not because someone reports it as fixed.
That's the difference between asserting a change worked and verifying it did. The result is checked against the condition it was intended to change, against that defined criterion — not simply reported as improved because someone said so.
Once the firm wants to evaluate live Governance, LexSteer runs Shadow Mode once: for roughly 30 days, it observes the live intake operation exactly as full Governance would — logging every Handoff that missed its expected timing, every case where a backup path would have been used, and every unresolved stall that would have required escalation — but stays read-only, without rerouting, escalating, or touching a single live case.
By the end of the 30 days, the COO has a concrete picture of what governed execution would look like in the firm's own intake environment. The question is no longer whether Governance is conceptually attractive. It is whether the firm wants the specific protections it has already seen turned on.
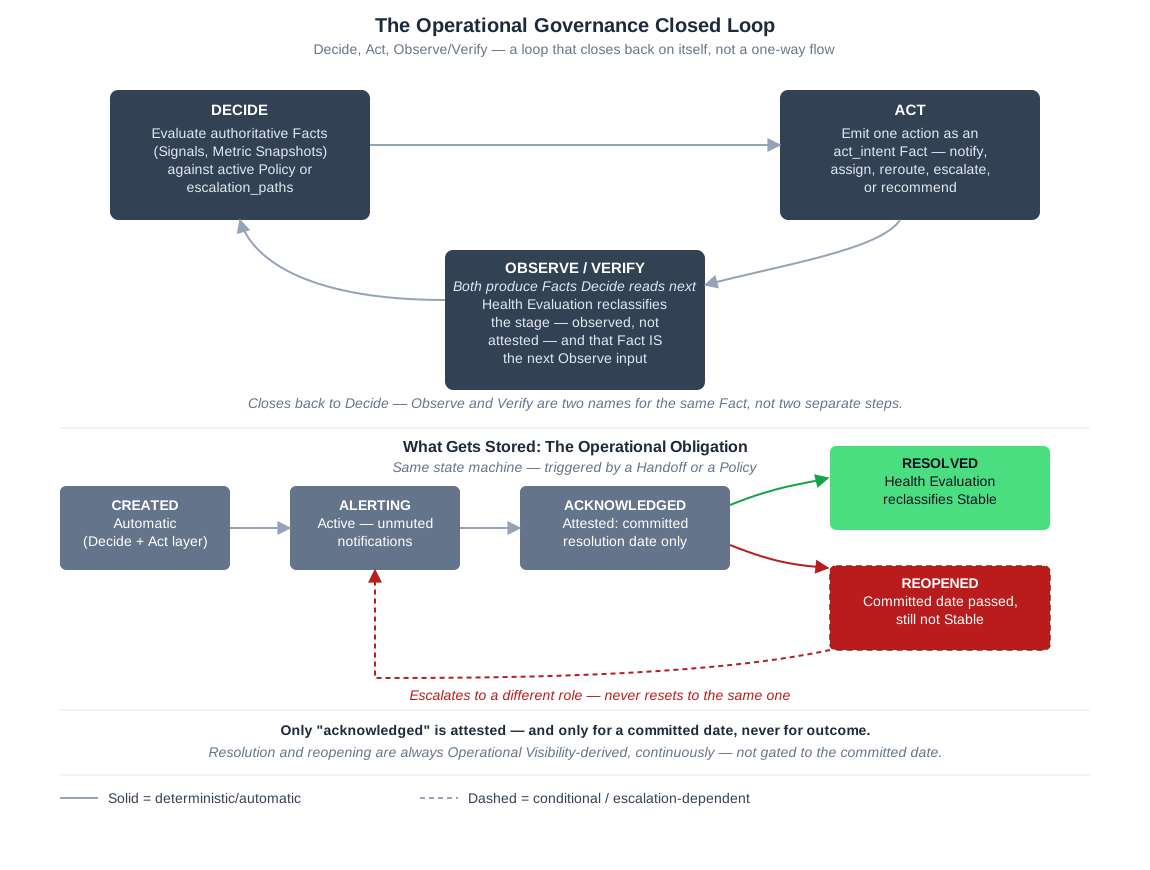
Once management decides which operating conditions matter enough to sustain and establishes the appropriate policy, Governance supervises those conditions during everyday execution — not as a one-time check, but whenever the governed condition occurs.
Many of those conditions concern critical Handoffs — the transitions through which intake work moves from one person, system, or stage to another. A Governed Handoff is not just a task with a reminder attached. It is a transition watched against a defined timing expectation, with a rule for what happens if the intended owner does not respond in time. That governed sequence is straightforward:
LexSteer detects that a critical Handoff has stalled — a transition that should have advanced and hasn't.
A prospect calls at 9:14 PM on a campaign tracking number. Your telephony platform logs the call. Your CRM has no matching record. The Handoff has stalled — LexSteer sees the gap immediately.
It applies the firm's timing and ownership rules — the SLAs and policies that define how that specific Handoff is supposed to behave.
It reroutes to a backup owner or path when the primary owner does not respond in time, so the case keeps moving instead of waiting.
It escalates when the backup path does not resolve the gap — carrying the problem upward until someone can act on it.
It verifies whether the case actually recovered and moved to the next stage. The loop doesn't close on the alert — it closes on the outcome.
That whole sequence creates a single Operational Obligation. It moves from created to alerting automatically, is acknowledged only by a committed resolution date — never by a claim that the fix worked — and closes only when operating evidence confirms that the required outcome or next stage was actually reached, or reopens and escalates to a different role if the committed date passes first.
This is the difference between alerts and Governance. Alerts tell the team that something went wrong. Governance supervises the resulting obligation until operating evidence establishes the required outcome — or the obligation reopens and escalates. Governance is the mechanism, sustained improvement is the outcome it serves.
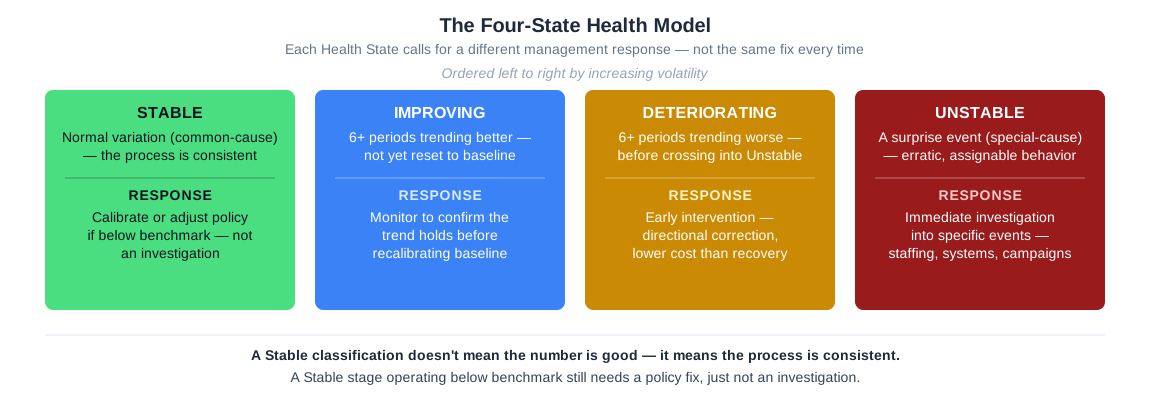
Not every warning sign means the same thing, and treating them as if they do wastes a firm's attention on the wrong problem. Once a Handoff is governed, LexSteer classifies its stage into one of four health states, because each calls for a different response.
A Stable stage that's underperforming needs a calibration change, not an investigation.
An Improving stage needs to be watched to confirm the gain holds, not treated as already fixed.
A Deteriorating stage needs early intervention before it breaches control limits — catching it there is what keeps its effects from propagating into downstream signed-case results.
An Unstable stage needs investigation into a specific event, because something identifiable just happened.
Catching a stage moving toward Deteriorating here — while it's still a stage-level pattern — is what keeps a problem from having to wait until it shows up in the firm's aggregate signed-case number before anyone notices.
For a COO responsible for intake performance, this is the layer that turns “we assigned it” into “we know it was handled,” with a traceable loop from detection, to response, to verification — protecting gains, not just achieving them, long after the original project ends.
Governance runs continuously, but a COO or managing partner sometimes needs to look backward, not just trust that it worked. Operational Playback lets you move to any point in your firm's intake history and see, at that exact moment, what the operation looked like and what LexSteer was doing about it — which Handoffs were open, what had already been escalated, and what verification had or hadn't completed. It's historical and read-only: Playback doesn't change anything or re-run anything, it shows you what already happened.
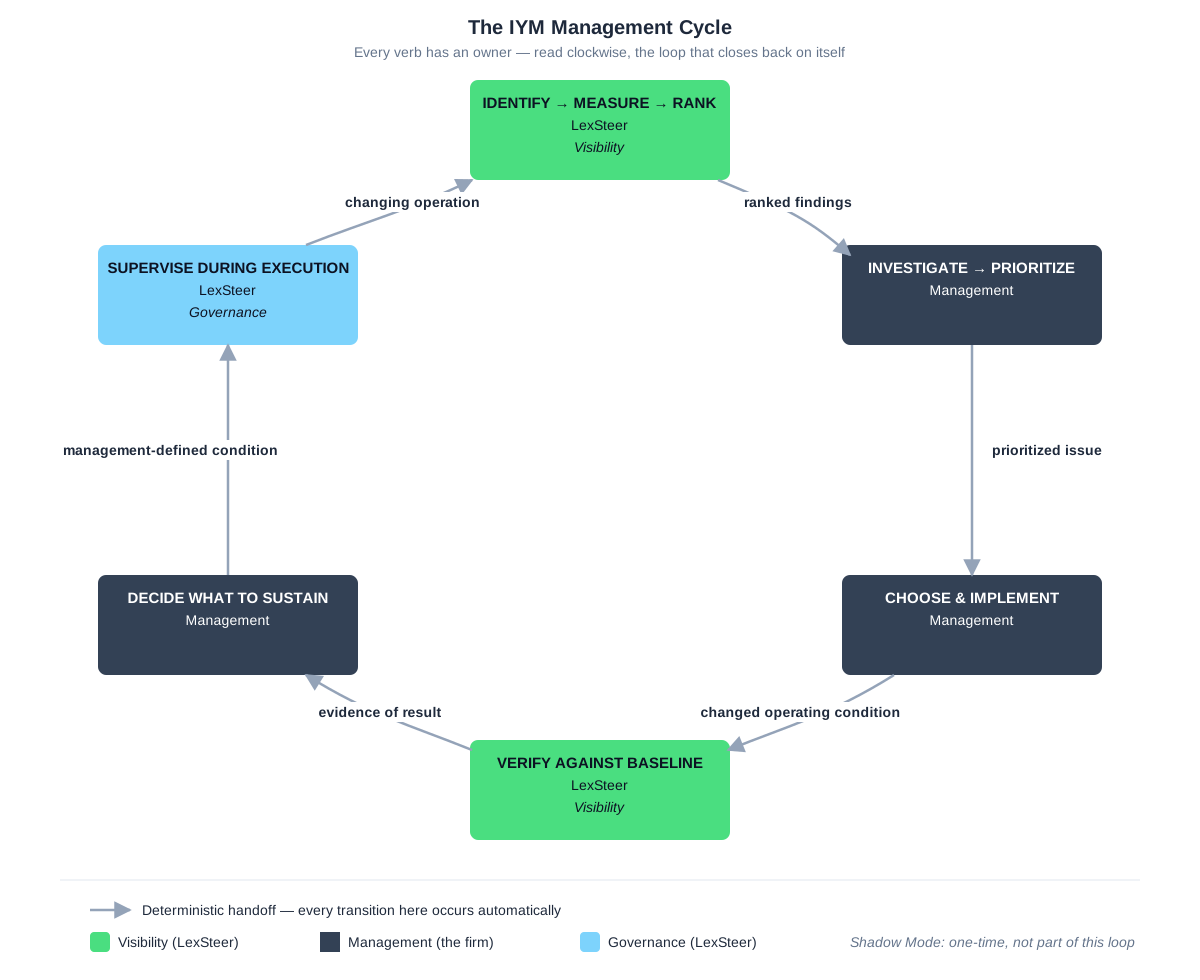
Visibility identifies, measures, and ranks the findings. Management investigates the underlying issue, prioritizes what to address, and implements the improvement. Visibility verifies the result. Management decides which conditions matter enough to sustain. Governance supervises those conditions during execution. As the operation changes, Visibility continues measuring performance and surfacing new findings, and the management cycle continues.
Together, this is Continuous Operational Improvement: not a one-time intervention, but a loop the firm controls, with the four-state health picture showing exactly when the next constraint needs attention.
The goal is a more durable intake operation whose critical Handoffs are visible, governed, and less dependent on memory or heroic oversight.
For the COO or intake director, that means a way to keep signed-case performance from sliding backward in the background while day-to-day demands compete for attention. For firm leadership, it is how gains hold instead of fading after the initial fix.
Numbers are illustrative. The structural pattern is the point.
A process that runs on the managing partner's direct knowledge of every case is not an asset — it is a dependency. As a firm grows from five attorneys to ten to fifteen, intake volume, staffing, channels, and Handoffs all change, and a process that worked cleanly at five attorneys can degrade badly by fifteen while the headline signed-case count still appears to be growing — the decay hides behind rising outcome numbers until it's already expensive to fix. Visibility, run early, establishes the baseline that makes that drift detectable as it begins; run later, it still shows where the current process is failing and what recovery is worth from today's numbers.
See the full worked example — three growth stages, same firm, and why the baseline timing matters: Why Drift Gets More Expensive as Firms Grow →
The calculator below lets you work through your intake funnel with your own numbers — or leave the industry benchmarks in place to see what a typical mid-market PI firm is losing. Nothing you enter is stored or shared.
Lower-bound annual leakage
$0
0 recoverable signed cases / year
Current cost per signed case: — → With recovery: —
Composite loss rate: —
This estimate uses your Capture Failure Rate, Process Failure Rate, and Qualification Failure Rate inputs. QRR and RSR are held at benchmark values unless you have adjusted them. Your actual leakage is likely higher — the Visibility Pack is built from your firm's own telephony and CRM data and will show you the precise number at each stage.
Benchmarks: Capture Failure Rate from Clio 2024 Legal Trends Report. Process Failure Rate and Qualification Failure Rate are illustrative starting points — adjust to reflect your firm. QRR/RSR from Clio 2024 Legal Trends Report. Industry CPS $4,200 from same source.
The right first step is evidence, not product commitment. The strongest starting point is Visibility, because better action depends on seeing where loss is actually occurring, what kind of loss it is, and what it may be worth to recover.