Doubling the marketing budget and signing the same number of cases isn’t automatically a marketing problem. It’s often an intake problem wearing a marketing bill — but that’s a diagnosis to confirm, not assume.
A managing partner reviewing this month’s numbers sees two things moving in the wrong direction together: marketing spend up twelve percent, signed cases roughly flat. The instinctive read is that the campaigns underperformed — wrong creative, wrong channel, an agency overdue for a hard conversation. Nobody asks the harder question first: of everyone who tried to reach this firm last month, how many never became anything the firm can see at all?
That question rarely gets asked, because the firm isn’t measuring against the right denominator. It measures conversion against the leads it captured, and captured leads are not the same thing as the demand it paid to generate. The gap between those two numbers is where this article starts, and it’s bigger, more expensive, and more fixable than most firms assume.
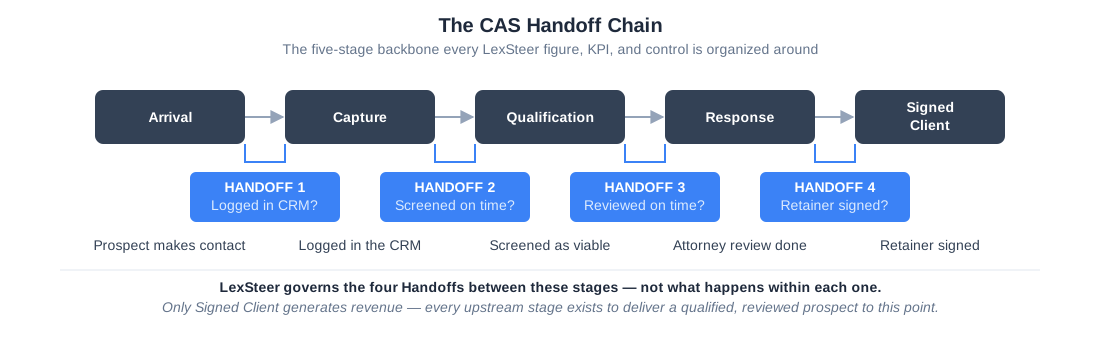
Every prospect moves through this same sequence — and every one of the four Handoffs between stages is a point where a case can quietly stop moving without anyone noticing.
A note on this sequence: these five stages name the control points that matter for diagnosing loss, not a claim that they’re the entirety of what an intake team does day to day. A firm’s actual process usually has more texture than five boxes — several callback attempts before a lead is marked unreachable, internal routing between staff, shift handoffs, and other work particular to how that firm operates. None of that finer-grained work competes with the sequence above; it happens inside one of these five stages, and which stage it belongs to is exactly what determines where a loss gets attributed.
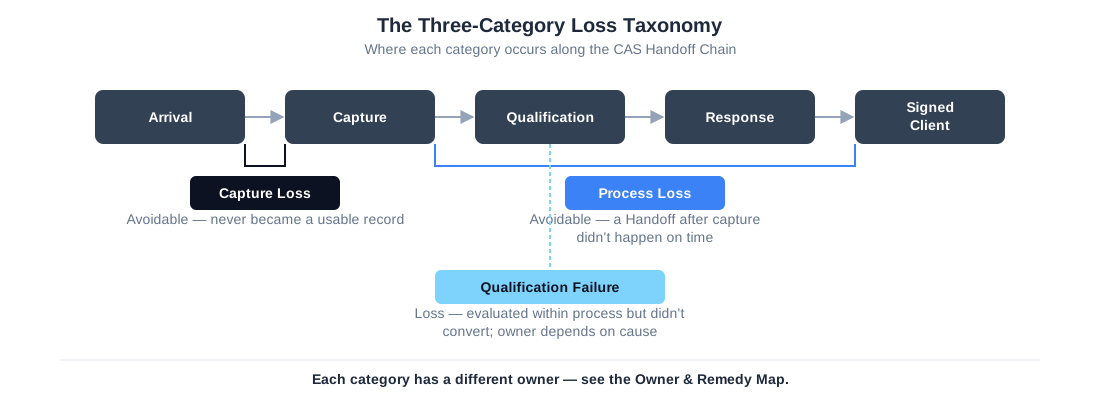
Loss shows up differently depending on where in that chain it happens, which is why treating “we’re losing cases” as one problem instead of three is the first mistake.
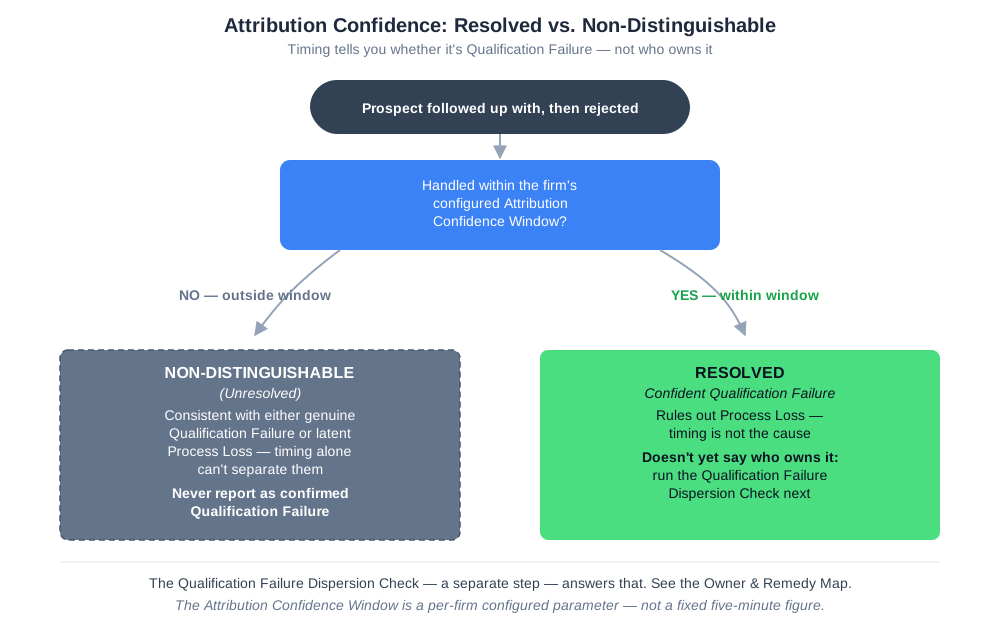
Telling a stalled Handoff apart from a genuine Qualification Failure usually comes down to timing — a distinction this article uses throughout, starting with the number most firms track instead.
The Instinctive Fix, and Why It Doesn’t Fix Anything
Client acquisition costs in personal injury have been climbing for years, and a market consolidating around firms with bigger media budgets makes the trend feel permanent rather than cyclical. Faced with that pressure, the response most firms reach for first is more: more spend, more leads, more channels. It’s the lever that’s visible, budgeted, and entirely within a managing partner’s control to pull on a Monday morning.
It’s also, on its own, the wrong first move — for a reason most firms never calculate, because the number they track doesn’t surface it. Take a firm spending $15,000 a month on marketing and getting 53 leads into its CRM. Divide one by the other and the math says $283 per lead, a number that shows up clean on a marketing report. It is not, however, the number that determines whether the firm makes money on that spend. Add the cost of the staff fielding and qualifying those 53 leads — say $12,000 a month — and divide the full $27,000 against the four prospects who actually signed, and the real cost of acquisition comes to $6,750 per case: roughly twenty‑four times the number marketing quoted. Both figures describe the exact same month of spending. Only one of them describes what the firm actually paid to put a signature on a retainer.
There’s a structural reason this reflex persists even among partners who run the rest of the practice rigorously. Marketing spend is a budget line with an owner, a vendor, and a monthly invoice — it’s the kind of decision a firm is built to make. Intake leakage doesn’t show up as a line item anywhere. It hides inside a conversion percentage that looks acceptable, distributed across coordinators, callbacks, and qualification calls nobody is auditing for timing. A partner can authorize a twenty percent increase in ad spend in a single phone call. Finding and fixing a leak in the Handoff chain takes measurement first, and most firms have never built the habit of measuring it.
This is an illustration, not a prediction — the specific ratio is different for every firm, and a firm’s own arrival, capture, and signed‑case counts will show its own number once measured. But the direction of the gap is rarely in question. Buying more leads at $283 apiece doesn’t change a $6,750 true cost if the same leakage is still consuming the same share of every new batch. It just buys a bigger batch to leak from, at a price that looks like progress on the one report the firm is watching.
The Metric That’s Measuring from the Wrong Start Line
Ask a managing partner for the firm’s conversion rate and the number comes back instantly, usually straight from a CRM report: signed clients divided by leads. It’s the number the firm has tracked for years, the number an agency reports against, the number a partner meeting opens with. For most firms, it’s also the wrong number — not wrong in its arithmetic, wrong in its starting point.
A “lead,” in that calculation, is a contact that made it into the CRM. It is not every prospect who tried to reach the firm. Every call that hit a coverage gap, every web form that landed nowhere, every text message nobody logged — all of it happened before the CRM ever started counting, which means none of it appears in the denominator the firm is using to judge itself. The conversion rate most firms report is calculated against the demand that survived long enough to get recorded, not against the demand they actually paid to generate.
Here is what that gap looks like in practice. Picture a firm where 60% of true arrivals get captured into the CRM — an entirely ordinary capture rate. Measured against captured leads alone, that firm might calculate a 6.7% conversion rate and feel reasonably satisfied with it. Measured against everyone who actually tried to reach the firm, the true rate is 4.0% — not because four signed clients quietly became three, but because the honest denominator was larger than the one the firm was using. The firm wasn’t lying to itself. It was measuring from the wrong starting point, and the difference between those two numbers — roughly a third of the firm’s apparent performance — is demand that was paid for and never entered the count at all.
Run that gap across twelve months and the number stops being academic. A firm signing four cases a month from this pattern isn’t missing four cases a year through some unlucky string of declines — it’s running the same structural gap fifty‑two weeks running, on every dollar of marketing spend, in every month the firm reports a conversion rate it never questions. The cost compounds quietly, because the report that would reveal it was never built to make the comparison in the first place.
That gap is exactly the size of the problem this series exists to make visible. It doesn’t show up as a bad number. It shows up as no number — a kind of loss invisible to anyone reading only the metric the firm has always tracked, because the metric was never built to see it. The specific size of any one firm’s gap depends on its own capture rate, which only firm‑specific measurement can establish; the illustration above shows the shape of the problem, not any particular firm’s version of it.
Diagnosis Problem, Not a Remedy Problem
Faced with a conversion number that won’t move, most firms respond by changing the Remedy rather than questioning the Diagnosis underneath it. They buy more leads. They switch CRMs. They run another round of intake training. They hire another coordinator. Each of these is a reasonable thing to try, and each one is occasionally exactly right — which is precisely what makes the pattern so hard to break. A Remedy that genuinely fixes one firm’s actual problem gets recommended to the next firm with a different problem entirely, and the only feedback the second firm gets is that its numbers still haven’t moved.
This is a Diagnosis problem, not a Remedy problem, and treating it as the latter is why firms cycle through fixes without the signed‑case count ever responding the way the pitch promised. A new CRM doesn’t recover a call that was never logged. A round of objection‑handling training doesn’t shorten a forty‑eight‑hour callback delay. More leads don’t fix a qualification process that was already evaluating the right cases correctly and rejecting the right ones too. Each Remedy is built to solve a specific kind of loss, and applying it to a different kind of loss isn’t free — it costs the budget, the staff hours, and the goodwill of a team that tried the thing it was told to try and still didn’t see results.
Worse, a Remedy applied to the wrong Diagnosis doesn’t just fail quietly — it can look like it’s working for a while. A new round of training raises morale and call quality, which genuinely helps the cases that were always going to convert close a little faster. The signed‑case count ticks up slightly, the firm credits the training, and the actual Capture Loss or stalled Handoff underneath the flat months before it keeps running exactly as before — unmeasured, and now harder to find, because everyone believes the problem already got fixed.
This keeps happening not for lack of effort, but because “we’re losing cases” gets treated as one problem with one cause, when it’s actually a label covering several distinct failure modes that happen to produce the same flat number on the same monthly report. Until those modes are separated, every Remedy a firm reaches for is a guess dressed up as a decision.
Three Places, Three Owners
Separating those failure modes starts with naming them. Intake loss splits into three categories, and the distinction between them isn’t a matter of degree — it’s a matter of exactly where in the process the case disappeared. On paper, the three blur together easily, because all three produce the same visible symptom: a prospect who never signs. Telling them apart means looking at exactly where in the sequence the case stopped, not at how the loss eventually got reported.
Capture Loss is the most invisible of the three, because it leaves no record anywhere: a prospect contacted the firm and never became a usable record the firm can see — a call that hit a coverage gap, a text or web form nobody logged. It shows up as nothing, which is exactly why it survives undetected in firms confident their reporting is solid.
Process Loss is different in kind. The prospect made it into the system — there’s a record, a timestamp, a name — but a required Handoff somewhere after that didn’t happen on time, or didn’t happen at all: a callback that should have gone out in minutes went out in days; a qualification review that should have been assigned never was. A prospect lost to a six‑hour delay and one correctly rejected at qualification can look identical on a standard CRM report. They are not the same event, and they don’t share a fix.
Qualification Failure is different from the other two: it isn’t automatically an operational failure. The prospect was followed up with properly, within the firm’s configured Attribution Confidence Window — timing is ruled out as a cause. But that alone doesn’t say whether the case itself was never going to convert — Qualification Failure — Lead Quality, owned by whoever is sourcing the leads — or whether an intake agent misjudged a case that should have qualified — Qualification Failure — Judgment, owned by whoever is running intake. Both look identical once timing is ruled out; where the data is too thin to tell either way, the honest label is Qualification Failure — Undetermined (Shared Cause).
A note on terms: this “Lead Quality” is a narrower, case-level thing than the “Lead Quality” that shows up as one of three upstream candidates behind a signed-case shortfall generally (alongside Lead Supply and Intake Execution). That upstream question is about the overall mix of leads arriving — is the firm’s marketing sourcing the right kind of prospect in the first place. Qualification Failure — Lead Quality is narrower: for one specific, already-arrived lead, timing wasn’t the issue and the case itself just wasn’t a fit. The second is already part of what this taxonomy diagnoses today; the first is a different, upstream question this series doesn’t yet answer.
Three categories, three different Remedies. Capture Loss and Process Loss are both operational and resolve to the same owner: Operations. Qualification Failure’s owner depends on which pattern the data actually shows — a firm that skips that step ends up applying an intake fix to a marketing problem, blaming marketing for what was actually a stalled Handoff, or blaming lead quality for what was actually an intake agent’s judgment call. Separating them cleanly, using measured data rather than a guess, is a claim substantial enough to earn its own article rather than a paragraph here — that is the job of The Three Places Cases Disappear, later in this tier.
What Comes Next
None of this requires taking anything on faith. A firm’s own arrival counts, capture rates, and Handoff timestamps will show exactly where this gap sits in its own numbers.
The rest of this tier works through that gap from several directions:
- Why Yield Beats Spend in a Consolidating Market — the economic case for treating intake loss as a capital‑allocation problem, not marketing noise.
- Why Conversion Rate Doesn’t Tell You What’s Broken — why the metric above can’t, by itself, tell you which of the three categories is responsible.
- The Three Places Cases Disappear — the method that separates a stalled Handoff from a genuinely unqualified lead using real data.
- The Argument Every PI Firm Has — the three‑way blame cycle that erupts inside most firms once results disappoint.
- The Hidden Cost of Delay — why delay costs more than it appears to.
- What Your Intake Data Can and Can’t Tell You Yet — what a firm’s existing data can and can’t yet prove.
- Why Good Operations Leaders Still Miss Operational Loss — why even a capable operations leader can miss this kind of loss while doing everything else right.