Conversion rate is the most commonly cited intake metric. It is also one of the least useful for diagnosing what is actually wrong. A single percentage at the bottom of a report collapses every stage, every failure mode, and every kind of prospect into one number.
This article explains why that number can’t tell you where you are losing cases or why, and what you need instead.
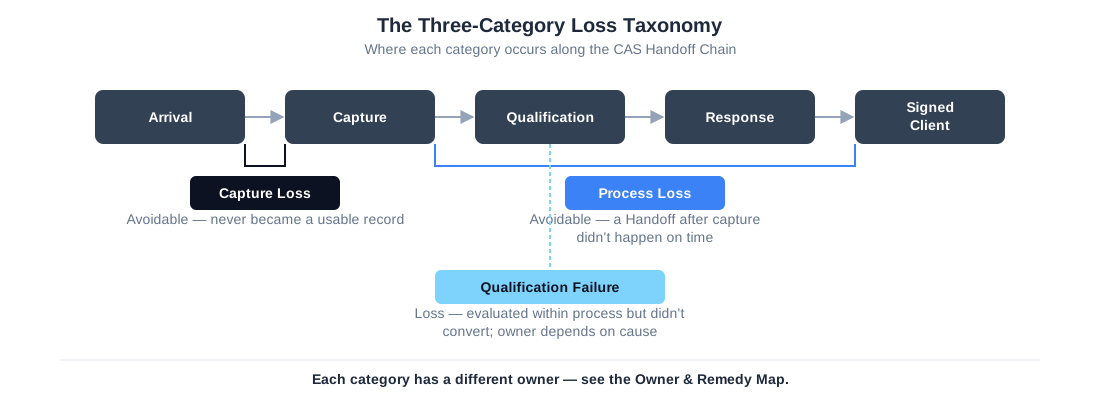
How different realities produce the same conversion number
Imagine two firms, both reporting a 12% conversion from lead to signed case.
Firm A answers almost every call, responds to forms quickly, and follows a disciplined review process. Most of its “no” decisions are genuine Qualification Failure — cases that were never going to be a fit, evaluated by a firm that gave them a fair, timely look. Firm B misses more calls, waits hours or days to return messages, and lets cases stall in review queues. Many of its “no” decisions are actually Capture Loss or Process Loss in disguise: prospects who might well have signed if the firm had reached them sooner, or at all.
On a dashboard, these firms look identical. Same percentage, same trend line, same monthly commentary about “steady performance.” In reality, Firm B is leaving far more value on the table — value it already paid marketing to generate. Conversion rate alone cannot distinguish between a firm with a genuine lead-quality problem and a firm with an execution problem wearing a lead-quality costume. Both produce a “no.” Neither the “no” nor the aggregate rate says which kind it was.
Why averaging hides the loss you care about
Conversion rate is an average of all outcomes over a period. Averages are useful for summarizing, but they are close to useless at revealing the patterns that actually cost a firm money: certain channels with systematically worse follow‑up, certain times of day or days of week when coverage gaps spike, certain case types that get stuck in review or fall between teams because no one owns the Handoff cleanly.
A firm might have near-perfect response times on business-hours phone leads and terrible ones on after‑hours web forms — and its blended conversion rate would show neither fact. It would show one number, sitting comfortably in the middle, telling leadership that things are fine on average while a specific, fixable failure mode quietly bleeds cases every night. All of these patterns can materially impact yield. They wash out completely in a single percentage, because the metric leadership relies on for insight is, by design, smoothing away the exact texture that matters.
The questions conversion rate can’t answer
When you look only at conversion, you cannot reliably answer how much loss is due to Capture Loss — prospects the firm never truly engaged in the first place — how much is due to Process Loss — prospects engaged but lost before retainer because a Handoff broke — or how much is genuine Qualification Failure, cases that were never going to be signed no matter how the firm handled them.
Without those distinctions, every conversation about lead quality or intake performance is guesswork dressed up as analysis. Marketing can plausibly blame intake for mishandling good leads. Intake can plausibly blame marketing for sending weak ones. Leadership is left adjudicating opinions instead of evidence, because the one number everyone is looking at was never built to settle the argument. Conversion rate tells you that something is wrong. It does not tell you what, where, or who owns the fix.
What you need instead of a single percentage
To diagnose intake loss, you need metrics that follow cases through stages rather than just tracking them into and out of the system as a whole. You need measures that distinguish contactability, process behavior, and qualification decisions from one another, that reveal timing patterns — where delays occur and how long they last — and that attribute outcomes to specific Handoffs rather than to departments or channels in the abstract.
This is where the Capture / Process / Qualification framework becomes more than vocabulary. It provides buckets for loss that can be measured and compared stage by stage, instead of left as one blended outcome that flatters no one and indicts no one. From there, the firm can make more precise decisions: which Handoffs to govern, where to invest in capacity, where to change filters, which channels genuinely have poor economics, and which are suffering from operational loss that has nothing to do with the demand itself.
Why this matters for your next improvement effort
If your improvement plan starts with “raise conversion by two points,” you are starting at the wrong end of the problem. That target is an outcome. It does not tell anyone what to build, fix, or govern, and it gives a team no way to know whether the two points came from real improvement or from a lucky month of stronger leads.
A better starting point is: reduce avoidable Capture and Process Loss by a defined share at specific stages. That forces operational clarity — which Handoffs are failing, what behaviors are missing, what rules and safeguards are needed, and how the firm will know if the change actually worked once it’s live. Conversion rate will move as a result of that work, but it will move for reasons the firm understands and can defend to a partner asking why.